Road Traffic: count, understand, control
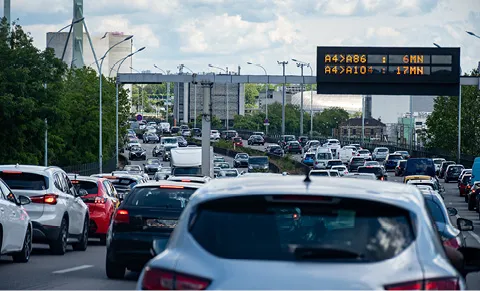
Vehicles, cyclists and pedestrians counted and classified with radar, loops and AI cameras, with noise, air and road surface next to the count. From the intersection to the motorway corridor, and ask baiond what happened this morning.

What goes wrong quietly.
A count from last spring
The traffic figures for the council meeting are from a two-week count a year ago. Whether the new bypass moved the trucks or the school street cut the morning peak is argued, not measured.
Noise and air on separate desks
The traffic count sits with the road department, the noise complaint with the environment office, the air-quality station with the state. Nobody sees on one chart that the 06:00 truck wave is what pushes the residents' street over 65 dB.
Maintenance after the damage
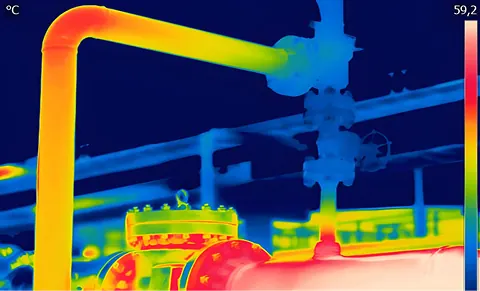
Black ice on the bridge, water in the underpass, the pavement breaking up under a heavy-vehicle detour: the road is inspected on a schedule, and the call comes from a driver.
Where the sensors sit.
Every dot is a sensor family in its typical place. Select one to see what it measures and what baiond does with it.
baiond brings the counters, the classifiers and the environment sensors of a road network on one platform: radar and loops on the corridor, AI cameras at the intersection, noise and air sensors on the residents' street, temperature and water level on the bridge and in the underpass. Every count is continuous, every vehicle class separate, every reading next to the weather. A council question becomes a chart with the weeks before and after the measure, and a reading that leaves its range, black ice at 05:40, water rising in the underpass, reaches the road service early, often before the first driver calls.
-
-

-
-
-



- Sensors
- baiond Gateway
- Visual Classification
- Space System
- AI Agents
- You
The same site, run differently.
A two-week count from last year for this year's decision.
Continuous counts per vehicle class, the weeks before and after the measure on one chart.
Noise complaints and traffic counts on two desks.
The truck wave and the 65 dB on the same timeline, with the address.
Black ice on the bridge, reported by the third driver.
Surface at 0.5 °C and falling: the road service gets the message at 05:40.
In use at and in partnership with


Your industry guide
One PDF for your industry: the questions baiond answers there, the sensors that measure it and what changes on site.
What managers ask before they start.
Which vehicles can baiond count and tell apart?
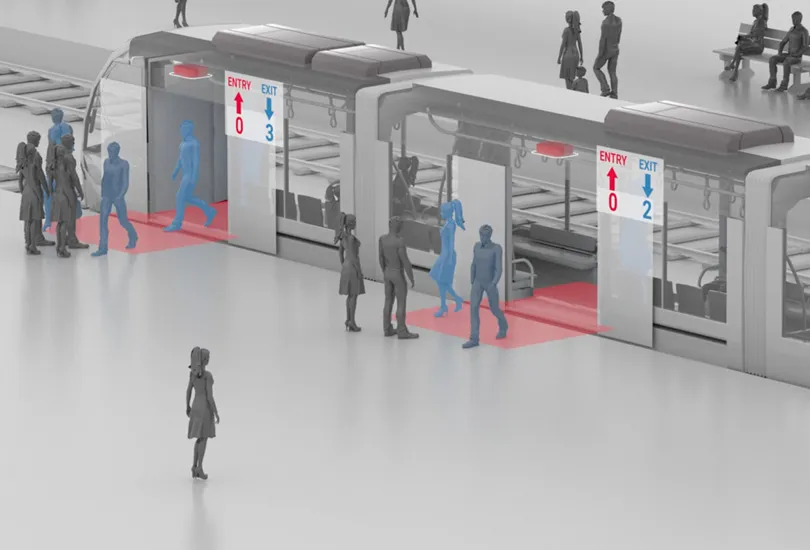
Cars, trucks, buses, motorcycles, bicycles and pedestrians, by direction and lane. Radar and loops count and measure speed; AI cameras classify. Which sensor fits depends on the road, and we choose it with you.
Are licence plates or faces stored?
No. The AI camera classifies the vehicle on the device and passes on a count with class and direction; no image and no plate leaves the sensor. Pedestrians and cyclists are counted, never identified.
Can we prove the effect of a traffic measure?
Yes. Counts run continuously, so a school street, a 30 km/h zone or a bypass gets the weeks before and after on one chart, per vehicle class and time of day, with noise and air next to it if you measure them.
Does baiond work with the counting stations we already have?
Usually yes. The baiond Gateway reads existing loops, radar and stations over Modbus, MQTT or the manufacturer's interface, so the new sensors and the old counts end up on the same timeline.
Related industries
Same sensors, same questions, a different floor.
-
-
-



Ready to give your data a voice?
Thirty minutes with the baiond team about your site and your questions. No slides.
Request a consultation