Reforestation & Mangroves: growth you can prove
Every planting on the map, every plot under satellite watch, soil and water measured on site. baiond turns a reforestation project into evidence that funders, carbon registries and partners can check.

What goes wrong quietly.
Planted, then out of sight
Three thousand seedlings went into the ground in March. How many are alive in October is a guess until someone walks the plot with a clipboard.
Reports that do not add up
Field teams, drone flights and satellite images each tell a slightly different story. The funder wants one number with a source.
Carbon and ESG rules keep tightening
Digital MRV, standardised reporting, verifiable survival rates: the requirements grow faster than a spreadsheet can follow.
Where the sensors sit.
Every dot is a sensor family in its typical place. Select one to see what it measures and what baiond does with it.
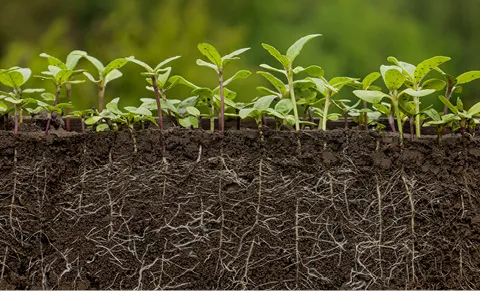
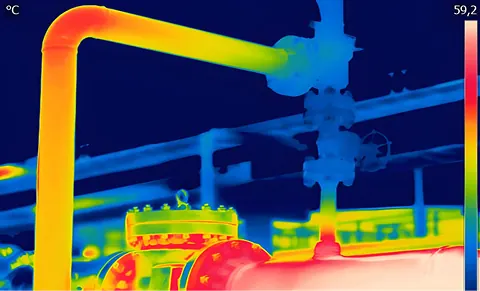
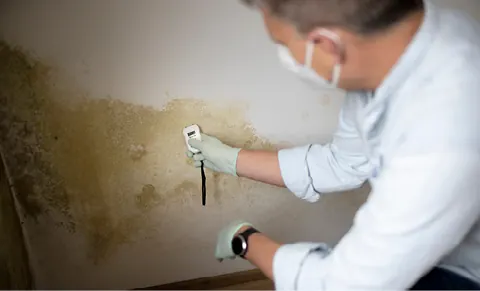
Project areas are drawn or uploaded as polygons, and from then on satellite data reports vegetation health, biomass and land-use change for each one. Field teams record every planting on the map with photos, species and conditions from their phone. Soil-moisture, salinity and temperature sensors in the monitoring plots, plus the nearest weather station, explain why one plot thrives and another does not. Manual counts, drone and satellite are compared in one place, so the survival rate you report is the one you can defend.
-
-
-
-


- Sensors
- Satellite & Weather Data
- Space System
- Graph Builder
- You
The same site, run differently.
Survival rate estimated once a year on foot.
Vegetation index per plot every few days, ground-truthed by the team.
Planting records in three formats and two languages.
One map, one form, every planting with photo and coordinates.
Weeks assembling the funder report.
Export the period, the plots and the sources. Done.
In use at and in partnership with


What managers ask before they start.
What does the satellite actually tell me about a plot?
Vegetation health as NDVI, biomass estimates, canopy change over time and alerts for fire or clearing. It cannot count seedlings; that is what the monitoring plots and the field app are for.
How do field teams record plantings?
With the mobile app: drop a pin, take a photo, choose the species, note the conditions. The form is a template you can adapt per project or partner, and it works offline until the next connection.
Is the reporting usable for carbon markets?
The data is structured for digital MRV: plots, plantings, survival, satellite and sensor evidence with timestamps and sources. Which standard you report against is your choice; the export follows it.
Can partners and donors see the project?
Yes, with role-based access per project and area. A donor sees the dashboard of the plots they fund, a field partner edits only their region.
Related industries
Same sensors, same questions, a different floor.
-
-
-


Ready to give your data a voice?
Thirty minutes with the baiond team about your site and your questions. No slides.
Request a consultation